Solar Panel Angle by State: Optimal Tilt for All 50 US States
The best solar panel angle in Miami is wrong in Minneapolis by 17 degrees.
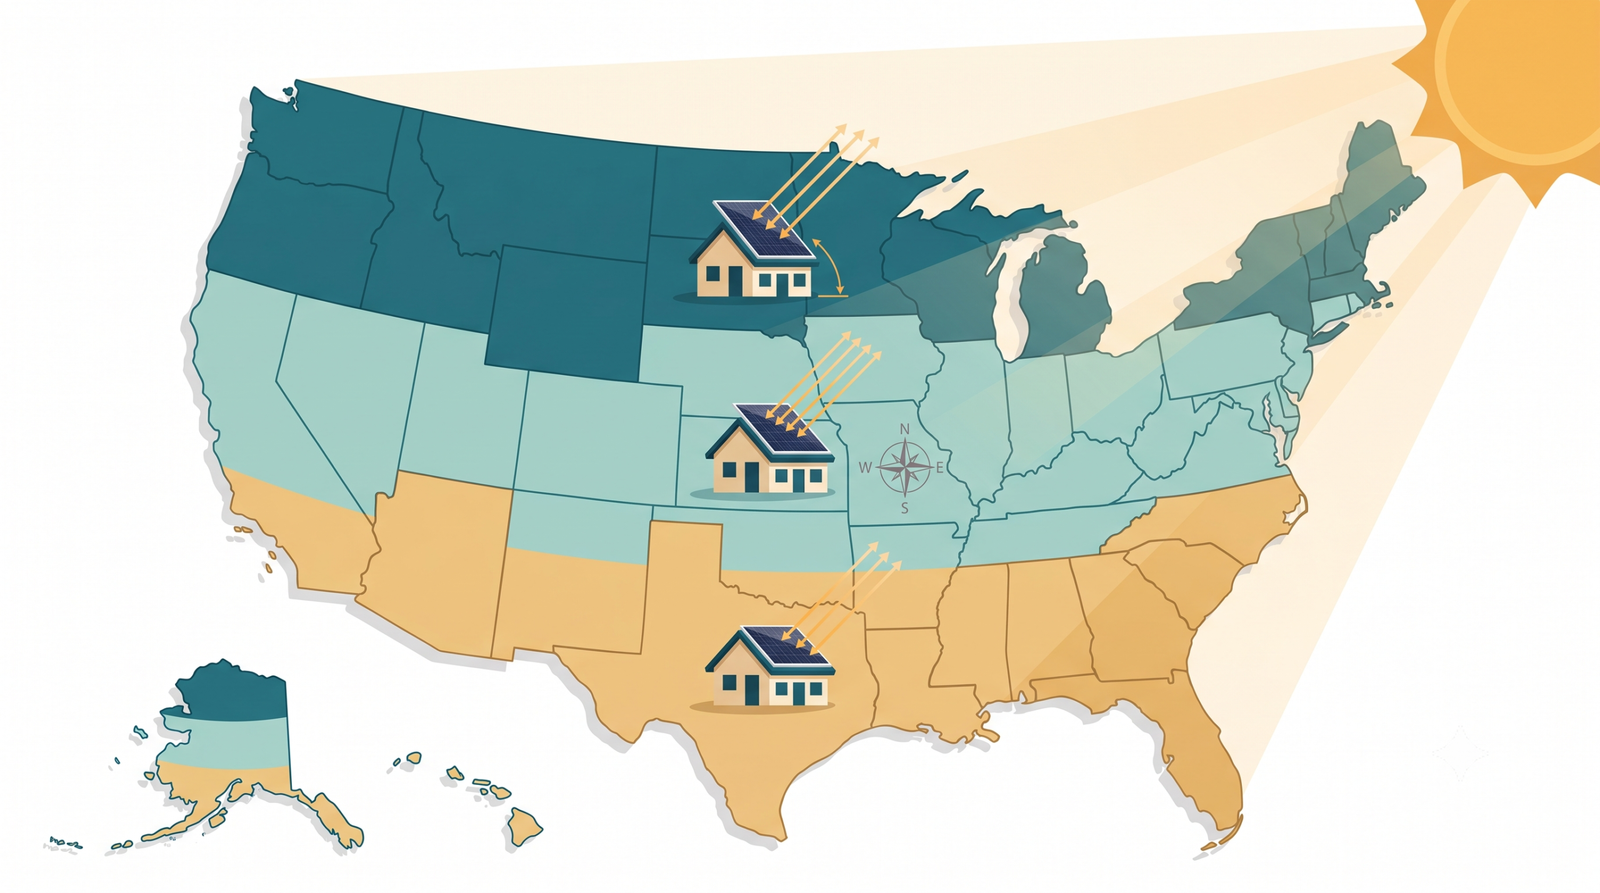
That’s the entire reason this reference exists. National averages — “just set your panels to 30°” — are correct for a narrow band of the country and quietly expensive everywhere else. Your state’s latitude sets your number, and the spread across the US is enormous: from 21° in Hawaii to 61° in Alaska.
Below you’ll find the complete 50-state table — annual, winter, and summer angles for every state — plus the regional adjustments that raw latitude math doesn’t capture: the cloud correction for the Pacific Northwest, the snow correction for the northern tier, and the special cases that are Alaska, Hawaii, and Florida.
Bookmark it. This is the page you’ll come back to.
Key Takeaways
- Optimal solar panel angles across the US range from 21° (Hawaii) to 61° (Alaska), driven almost entirely by each state’s latitude.
- Most of the Lower 48 falls between 29° and 47° for a fixed year-round installation.
- Winter angles run roughly 15° steeper than annual; summer angles run 15° flatter.
- These are latitude-based baselines: cloudy regions (Pacific Northwest) trim 5–10° flatter, and heavy-snow states often benefit from 5–10° steeper.
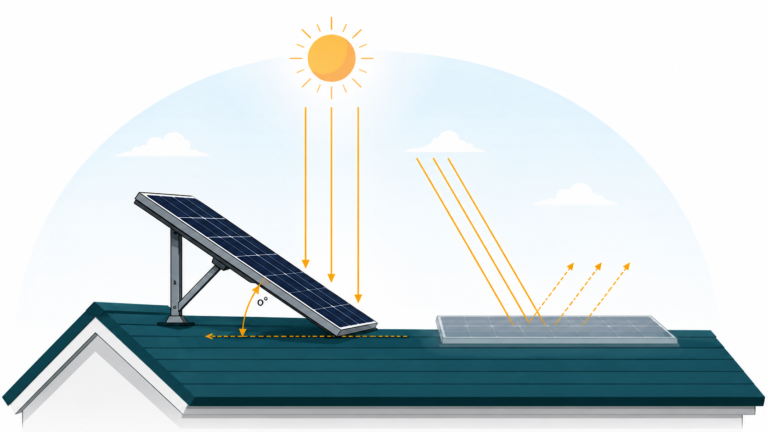
- If your roof pitch lands within 10–15° of your state’s number, flush-mounting beats paying for tilt racking.
- State-level numbers are a starting point — a state like Texas spans 10° of latitude, so exact coordinates always beat the state average.
The Quick Answer
The optimal solar panel angle for each US state approximately equals that state’s latitude. Southern states like Florida and Texas perform best near 29–31°, mid-latitude states like Colorado and Ohio near 39–40°, and northern states like Washington and Minnesota near 46–47°. Winter angles add about 15°; summer angles subtract about 15°.
How This Table Was Built (Read This First)
Transparency beats magic, so here’s the method:
- Each state’s angle uses its geographic center latitude — the balance point of the state’s land area.
- Annual angle = latitude, the standard baseline validated against NREL irradiance modeling.
- Winter = latitude + 15° and summer = latitude − 15°, the season-wide adjustment rule.
- All values round to the nearest degree, because panel output within ±5° of optimal varies by only about 1% — decimal precision here would be theater.
Two honest limitations. First, a state is not a point: Texas stretches from 26°N to 36°N, so El Paso and Amarillo genuinely want different angles. Second, latitude math assumes clear skies — climate corrections follow the table. For your street-level number rather than your state’s average, calculate the optimal tilt angle for your exact location and it will return annual, seasonal, and monthly angles from your actual coordinates.
The Complete 50-State Solar Panel Angle Table
| State | Center Latitude | Annual Tilt | Winter Tilt | Summer Tilt |
|---|---|---|---|---|
| Alabama | 32.8°N | 33° | 48° | 18° |
| Alaska | 61.2°N | 61° | 76° | 46° |
| Arizona | 34.3°N | 34° | 49° | 19° |
| Arkansas | 34.9°N | 35° | 50° | 20° |
| California | 37.2°N | 37° | 52° | 22° |
| Colorado | 39.0°N | 39° | 54° | 24° |
| Connecticut | 41.6°N | 42° | 57° | 27° |
| Delaware | 39.0°N | 39° | 54° | 24° |
| Florida | 28.6°N | 29° | 44° | 14° |
| Georgia | 32.6°N | 33° | 48° | 18° |
| Hawaii | 20.8°N | 21° | 36° | 6° |
| Idaho | 44.4°N | 44° | 59° | 29° |
| Illinois | 40.0°N | 40° | 55° | 25° |
| Indiana | 39.9°N | 40° | 55° | 25° |
| Iowa | 42.0°N | 42° | 57° | 27° |
| Kansas | 38.5°N | 38° | 54° | 24° |
| Kentucky | 37.5°N | 38° | 52° | 22° |
| Louisiana | 31.0°N | 31° | 46° | 16° |
| Maine | 45.4°N | 45° | 60° | 30° |
| Maryland | 39.0°N | 39° | 54° | 24° |
| Massachusetts | 42.3°N | 42° | 57° | 27° |
| Michigan | 44.3°N | 44° | 59° | 29° |
| Minnesota | 46.3°N | 46° | 61° | 31° |
| Mississippi | 32.7°N | 33° | 48° | 18° |
| Missouri | 38.4°N | 38° | 53° | 23° |
| Montana | 47.0°N | 47° | 62° | 32° |
| Nebraska | 41.5°N | 42° | 56° | 26° |
| Nevada | 39.3°N | 39° | 54° | 24° |
| New Hampshire | 43.7°N | 44° | 59° | 29° |
| New Jersey | 40.1°N | 40° | 55° | 25° |
| New Mexico | 34.4°N | 34° | 49° | 19° |
| New York | 42.9°N | 43° | 58° | 28° |
| North Carolina | 35.5°N | 36° | 50° | 20° |
| North Dakota | 47.4°N | 47° | 62° | 32° |
| Ohio | 40.3°N | 40° | 55° | 25° |
| Oklahoma | 35.6°N | 36° | 51° | 21° |
| Oregon | 43.9°N | 44° | 59° | 29° |
| Pennsylvania | 40.9°N | 41° | 56° | 26° |
| Rhode Island | 41.7°N | 42° | 57° | 27° |
| South Carolina | 33.9°N | 34° | 49° | 19° |
| South Dakota | 44.4°N | 44° | 59° | 29° |
| Tennessee | 35.8°N | 36° | 51° | 21° |
| Texas | 31.4°N | 31° | 46° | 16° |
| Utah | 39.3°N | 39° | 54° | 24° |
| Vermont | 44.0°N | 44° | 59° | 29° |
| Virginia | 37.5°N | 38° | 52° | 22° |
| Washington | 47.4°N | 47° | 62° | 32° |
| West Virginia | 38.6°N | 39° | 54° | 24° |
| Wisconsin | 44.6°N | 45° | 60° | 30° |
| Wyoming | 43.0°N | 43° | 58° | 28° |
Regional Breakdowns: What the Table Doesn’t Say
Latitude sets the baseline. Climate edits it. Here’s how each region should read its row.
The South (25–35°N): Florida, Texas, Gulf States, Desert Southwest
Shallow angles, generous sun, and one warning: don’t go flatter than your table value chasing summer output. Below 10° of tilt, rain stops washing dust off the glass, and in pollen-heavy Gulf states that grime tax is real. Florida’s flat-roof homes especially should rack up to at least the annual number.
The Desert Southwest — Arizona, New Mexico, Nevada — is where latitude math performs at its absolute best: clear skies, minimal diffuse-light correction, and some of the highest solar resource numbers NREL has ever mapped. Set the table value and collect.
The Mid-Latitudes (35–42°N): The Transition Belt
Virginia through Kansas through Northern California — the band where most American solar lives. The table values here need the fewest corrections, and this region has the highest odds that your existing roof pitch already lands within tolerance: an 8/12 roof (33.7°) or 10/12 roof (39.8°) brackets most of these states beautifully. Check your pitch before pricing any racking.
The Northern Tier (42–48°N): Snow Changes the Math
Minnesota, Wisconsin, Michigan, Montana, the Dakotas, New England. Two forces push the same direction here — steeper:
- Snow shedding. A panel at 50°+ clears snow in hours; a panel at 35° can stay buried for days. Buried panels produce zero, and the clear, cold days after a storm are actually high-efficiency days for the panels that can see them.
- Winter-weighted value. Heating loads and short days make cold-month production disproportionately valuable, especially for heat-pump homes.
Practical read: treat your table value as the floor, and consider running 5–10° above it if winters hit hard where you live.
The Pacific Northwest: The Cloud Exception
Western Washington and Oregon carry the highest latitudes in the Lower 48 — and shouldn’t fully use them. Persistent cloud cover converts much of the light to diffuse radiation scattered across the whole sky, and flatter panels collect more of it. The practical adjustment: take the table value and subtract 5–10°. A Seattle-area system often optimizes near 38–42° rather than the raw 47°. (East of the Cascades, skies clear and the standard number returns.)
Alaska and Hawaii: The Bookends
Alaska (61°): Extreme latitude, extreme seasons. The annual number is honest but almost beside the point — winter days are so short that most Alaskan systems optimize for the long, bright shoulder seasons and summer, often running flatter than 61°. Vertical and near-vertical mounting also earns its keep here: zero snow accumulation and solid performance under a sun that never climbs high.
Hawaii (21°): The flattest state in the table, and the one place the 10° self-cleaning floor does the most work. The summer column says 6°; ignore it and hold at least 10–15° year-round. At this latitude the total cost of doing so is a rounding error.
Reading Your Row: A Worked Example
Take Wisconsin, row by row, decision by decision.
The table says: 44.6°N center latitude, 45° annual, 60° winter, 30° summer.
Step one — regional read. Wisconsin sits in the snow belt, so the 45° annual figure is a floor, not a ceiling. A homeowner near Green Bay who’s watched panels stay buried for three January days would be well served at 50°, trading a sliver of summer output for winters that actually produce.
Step two — the roof check. Their house has a 10/12 pitch: 39.8°. That’s within 10° of the table value — inside the flush-mount zone. Verdict: mount flush at 40°, skip the racking, accept a 1–2% haircut, and bank the savings.
Step three — the exception check. But suppose the same homeowner runs a ground-mounted array behind the garage instead. Now the angle is free, snow logic applies in full, and 50° with a twice-yearly adjustment becomes the winning play.
Same state, same row, two different right answers. That’s how the table is meant to be used: as the anchor for a short chain of judgment calls, not as a commandment.
How to Use Your State’s Number: Step by Step
- Find your state’s annual angle in the table.
- Apply at most one regional correction: −5–10° in the cloudy Northwest, +5–10° in serious snow country. Most states: no correction.
- Compare against your roof pitch. Within 10–15°? Flush-mount and spend the racking money on another panel.
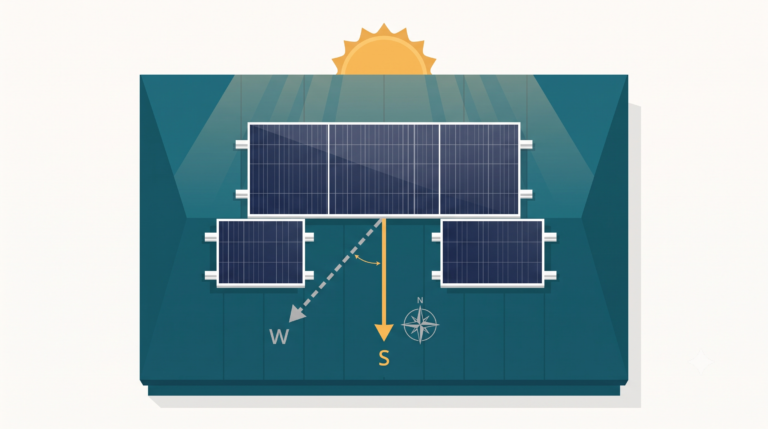
- Confirm your direction. The angle only pays when panels face true south — and compass south is off by up to 15° in parts of the country. The true south solar panel direction guide covers the two-minute correction.
- Refine with exact coordinates if you’re in a tall state (Texas, California, Florida, Nevada, Idaho) where the state average can miss your city by several degrees.
Common Mistakes
Using the state number in a state that spans 10° of latitude. Brownsville, TX (25.9°N) and Dalhart, TX (36.1°N) share a table row and shouldn’t share an angle. Big states demand coordinates, not averages.
Applying the summer column as a year-round setting. The summer figure is for adjustable systems during summer months only. Locking a Florida array at 14° permanently trades away winter production and self-cleaning.
Ignoring the 10° floor in southern states. Hawaii’s and Florida’s summer values dip below the rain-cleaning threshold. Flat means dirty, and dirty means a permanent output tax no formula shows.
Paying for racking to close a 6° gap. The table is a target, not a mandate. Within 10–15°, the production difference is a few percent — less than the racking costs.
Optimizing the angle on a shaded roof. A tree line that shades your array from 2 PM onward costs more than any tilt error in this table. Shade analysis comes first, always.
Expert Tips
Renters of the table, beware the centroid. Each state’s value uses its geographic center. If you live near a state line, your neighbor-state’s row may be more accurate than your own — latitude doesn’t care about borders.
Adjustable ground mounts: your state row is a schedule. Annual, winter, summer — that’s three of your four settings, with spring/fall matching the annual column. The next article in this series turns those columns into a calendar.
New construction is the cheat code. Designing a roof? Pitch the south face at your state’s annual angle and the entire roof becomes free optimal racking. A 10/12 pitch is nearly perfect for two dozen states.
Verify with production data after install. Your inverter app’s daily curve should peak at solar noon and match seasonal expectations. Systematic underperformance against PVWatts estimates for your angle usually means shading or aim — not the tilt number.
Best Practices Recap
Start from your state’s row. Correct once, if your climate demands it — flatter for persistent cloud, steeper for serious snow. Respect the 10° self-cleaning floor everywhere. Let your existing roof win any argument within 15°. And graduate from state averages to exact coordinates the moment hardware decisions get real, because latitude is personal and states are wide.
Conclusion: Fifty States, One Rule, A Handful of Exceptions
Every row in that table is the same physics wearing a different latitude: panels tilt to meet the sun’s average height, and the sun’s height depends on how far north you stand. Southern states lie shallow, northern states stand steep, and the exceptions — clouds, snow, Alaska, Hawaii — bend the rule in predictable directions.
Your state’s number is the fixed-mount answer. But if your system can move, there’s another 4–5% on the table: the winter and summer columns you just read are two settings of a four-season schedule. Next in this series, adjust your solar panel angle by season — when to change, what to change to, and when the ladder isn’t worth it.
Find your row. Set your angle. Let geography do the rest.
Frequently Asked Questions
What is the best solar panel angle for my state?
Approximately your state’s central latitude: 29° in Florida, 37° in California, 43° in New York, 47° in Washington. The full 50-state table above lists annual, winter, and summer angles for every state.
What angle should solar panels be in Texas?
About 31° for a year-round fixed mount at the state’s center — but Texas spans 26°N to 36°N, so South Texas homes optimize nearer 27° and Panhandle homes nearer 35°. Exact coordinates beat the state average here more than almost anywhere.
What is the best solar panel angle in California?
Around 37° statewide, ranging from roughly 33° in San Diego to 41° near the Oregon border. California’s mostly clear skies mean the latitude rule applies with little correction.
What angle should solar panels be in Florida?
About 29° year-round. Hold at least 10–15° of tilt even in summer despite the flatter mathematical optimum — below 10°, rain stops cleaning the glass, and Florida’s pollen and dust make that tax expensive.
What is the best solar panel angle in Arizona?
About 34°, and Arizona is where latitude math works best: clear desert skies, minimal diffuse-light correction, and among the strongest solar resources in the country. Set the number and collect.
Do northern states need steeper solar panel angles?
Yes, twice over. Their higher latitudes demand steeper baseline angles (44–47° across the northern tier), and heavy snow rewards going 5–10° steeper still — steep panels shed snow in hours instead of days.
Why is the Pacific Northwest an exception to the latitude rule?
Persistent cloud cover scatters sunlight across the whole sky as diffuse radiation, and flatter panels see more sky. Western Washington and Oregon typically optimize 5–10° below their latitude — around 38–42° near Seattle instead of the raw 47°.
Should my panels match my roof angle or my state’s angle?
If your roof pitch falls within 10–15° of your state’s number, flush-mount — the few percent of lost production costs less than tilt racking. Beyond that gap, or on flat roofs and ground mounts, build to the table value.
Is one number enough for a whole state?
It’s a starting point, not a verdict. Small states like Connecticut are well-served by one value; tall states like Texas, California, and Idaho span enough latitude that city-level coordinates can shift the answer by 3–5°.
Do these angles change over time?
The latitude-based angles are permanent — geography doesn’t move. What changes is your situation: new shading, added panels, an EV or heat pump shifting when you need power. Revisit the number when your usage does.